

Provides a JVisualVM Plug-in allowing developers to view a dashboard of summarized statistics and information when connected via JMX to a Coherence cluster.
This is a developer-oriented tool for viewing information about a single Coherence cluster, typically during the development process. For monitoring, managing and alerting in production, large-scale or enterprise level environments we recommend using operations-oriented tools such as Oracle's Enterprise Manager, Fusion Middleware Control and/or other 3rd party tools.
The JVisualVM Plug-In is distributed in the NetBeans Module (nbm) file
called: coherence-jvisualvm-12.1.0.nbm. This is available from
(maven.java.net)[https://maven.java.net] (or Maven Central). It's also available in the
standard Maven target directory after a successful build.
To build the plug-in you require the following additional repository in your Maven settings.xml:
<repository>
    <id>jvisualvm</id>
    <name>jvisualvm</name>
    <url>http://bits.netbeans.org/nexus/content/groups/visualvm/</url>
</repository>
While this plug-in is distributed as part of Coherence Incubator 12, it is routinely tested with Coherence 3.5.x, 3.6.x, 3.7.1.x and 12.1.2.0.x.
Once you have acquired or built the JVisualVM Plug-in, perform the following to install the plugin into your JVisualVM environment:
jvisualvm or jvisualvm.exe (for Windows) from the bin
directory under your Java home.coherence-jvisualvm-12.1.0.nbm
(perhaps from your target directory under coherence-jvisualvm folder).Once connected you will see the 'Coherence Tab' show below:
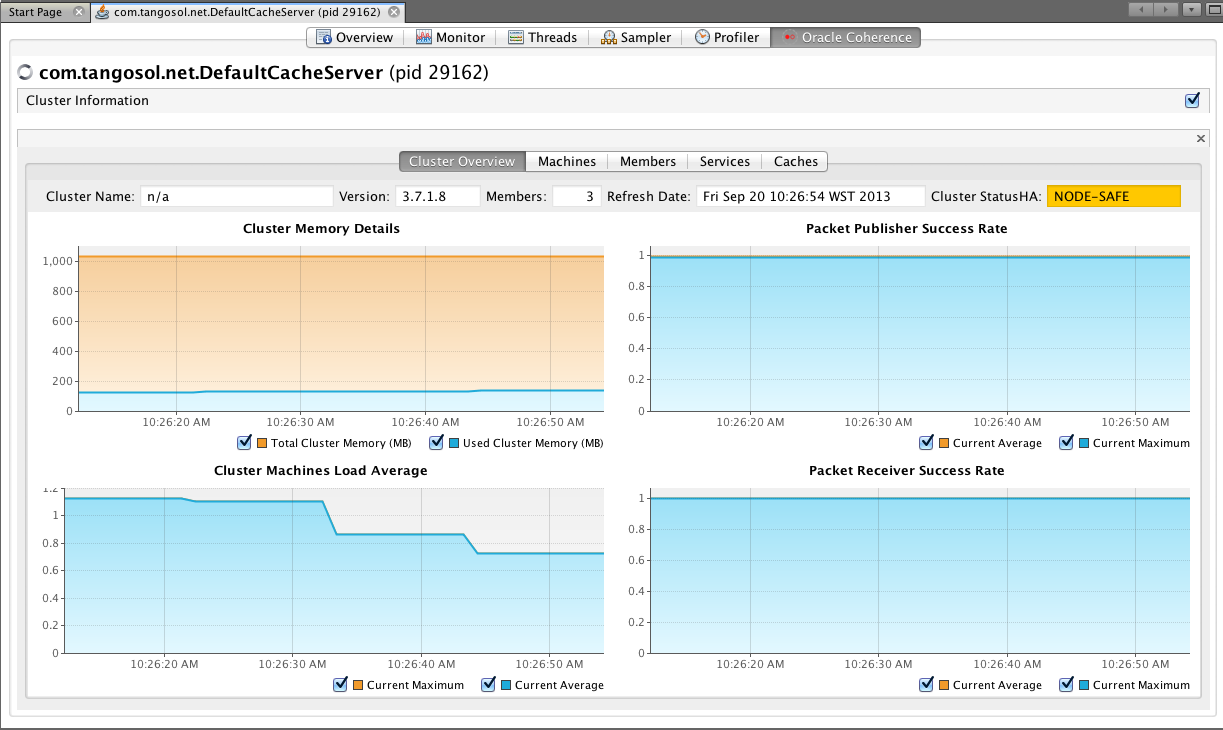
On selecting the 'Coherence Tab', the following sub-tabs are displayed:
Overview
Displays high-level information about the Coherence cluster including cluster name, version, member count and 'Cluster StatusHA'. Summary graphs show total cluster memory available and used, packet publisher and receiver success rates and load averages for machines running Coherence.
Machines
Displays a list of the physical machines that make up the Coherence cluster as well as information about the load averages and available memory on these machines.
Members
Displays the full list of Coherence members/nodes including individual publisher/ receiver success rates, memory and send queue sizes.
Services
Displays information about the running services including partition counts and statusHA values. If you select a service, on the next data refresh you will see detailed thread information for each node of the service as well as graphs of that information.
Caches
Displays information about any caches including size, and memory usage information.
To get the correct information to be displayed for memory usage, you must be using the binary
unit-calculator. If you select a cache, on the next data refresh you will see detailed information
about each node hosting that service and cache.
Proxy Servers
If your cluster is running proxy servers for Coherence*Extend, this tab displays information about the proxy servers and the number of connections across each proxy server and total connections.
Coherence*Web
If your cluster is configured for Coherence*Web, this tab displays information about the number applications deployed, the number of HTTP sessions being stored as well as other information regarding session reaping.
On any of the tables you are able to right-click and export the current data from that table as CSV.
Important: When using JMX to retrieve statistics from Coherence clusters which have large number of members, refreshing the statistics too often can put additional pressure on the cluster and adversely affect overall cluster performance. With this in mind it is recommended to change the 'Management Refresh' interval on the cluster you are monitoring from the default of 1 second to a value such as 60 seconds.
This can be achieved by using the following system property on your cache servers:
-Dtangosol.coherence.management.refresh.expiry=60s
See Oracle Documentation for more information.
JVisualVM has screen refresh intervals setup in the Preferences. The plug-in has been built to only refresh data from the Coherence MBean server by default every 30 seconds. Combined with the above management refresh setting, this should minimize the impact of running the plug-in on a Coherence cluster.
For development or demo purposes only, if you wish to refresh data more often, you can add the following property to the JVisualVM command line. (include the quotes)
jvisualvm -J"-Dcom.oracle.coherence.jvisualvm.refreshtime=10"
In Coherence 12.1.2, we introduced "Managed Coherence Servers", which is a new way of running Coherence within WebLogic Server environment. See the Oracle Documentation for more information.
When you are running Managed Coherence Servers, the WebLogic Server Domain Runtime MBean server
collects JMX information from all Coherence enabled managed servers and makes it available.
To connect to the Domain Runtime MBean server via JVisualVM requires a few more additional steps:
Source your WebLogic Server Environment
You should use . ./setWLSEnv.sh (for *NIX) or setWLSEnv.cmd (for Windows) to source your WebLogic Server environment. This script is available off your Middleware install directory in wlserver/server/bin.
Start JVisualVM with Additional Options
You will need to add the WebLogic Server libraries to the classpath as well as ignoring the MBean check as described below. I am using Linux for my example below so modify for your environment. (All options should be on the same line)
$JAVA_HOME/bin/jvisualvm --cp:a \
$WL_HOME/server/lib/wljmxclient.jar:$WL_HOME/server/lib/weblogic.jar \
-J-Djmx.remote.protocol.provider.pkgs=weblogic.management.remote \
-J-Dcom.oracle.coherence.jvisualvm.disable.mbean.check=true
Create a Connection from JVisualVM
Once JVisualVM has started, create a new local or remote connection by right-clicking on either 'Local' or 'Remote' under the 'Applications' tree. Use the following for the connection URI and enter the credentials for the WebLogic Server Admin server.
service:jmx:iiop://hostname:port/jndi/weblogic.management.mbeanservers.domainruntime
Once you have selected the newly created connection you will see the 'Coherence Tab'.
Coherence tab does not display when connected to WebLogic Server
By default, the the VisualVMViewProvider class checks for the existence of the
Coherence:type=Cluster MBean, and then only displays the Coherence tab.
In some cases when connecting to WebLogic Server Domain Runtime MBean servers
in 12.1.2.0.0, this Mbean does not show up immediately. You can disable this
check by adding the following proprty.
-J"-Dcom.oracle.coherence.jvisualvm.disable.mbean.check=true"
Coherence tab does not display when connected to standard Java Process
Ensure that you have are connecting to a Coherence MBean server. See Oracle Documentation for more information on enabling JMX in Coherence.
Information does not display on tabs
Navigate to 'About Java VisualVM' menu item and click on 'Logfile' to see if there are any exceptions raised. If you have found and issue please raise a bug.